Open a SIP statement anywhere between month twelve and month thirty-six, and the number staring back rarely feels like it belongs in a success story. It looks a lot like the sum of the amounts put in. A colleague's stock tip doubled in six months. The market just had a flat quarter. And the SIP, sitting there patiently, starts to feel less like an investment and more like a habit that hasn't paid off yet.
There's a four-hundred-year-old piece of Chinese farming folklore that explains this feeling better than most finance textbooks do, and once you see the parallel, it's hard to unsee it.
The Story Behind the Analogy
The Chinese bamboo plant, specifically a species called moso bamboo, has a growth pattern that has puzzled and fascinated farmers for centuries.
- A farmer plants a bamboo seed. He waters it every day, without fail.
- Year one: nothing breaks the surface. Just soil.
- Year two: still nothing.
- Year three: the neighbours start to notice, and to laugh.
- Year four: well-meaning people suggest he give up.
- Then, in year five, over roughly six weeks, the bamboo shoots up 80 to 90 feet.
It did not grow 80 feet in six weeks. It grew 80 feet in five years. The six weeks simply made the growth visible.
Underground, during those first four “silent” years, the plant is building a root network wide and deep enough to support the sudden vertical surge that follows. The growth was never absent. It was simply invisible, and it was happening in the wrong direction to be noticed.
The Same Curve Shows Up in Every SIP Statement
Run the numbers on a plain, ordinary SIP and the shape of the curve is identical. Take a simple example: ₹5,000 invested every month, growing at an assumed 12% annually, a reasonable long-run expectation for a diversified Indian equity portfolio, not a promise or a guarantee.
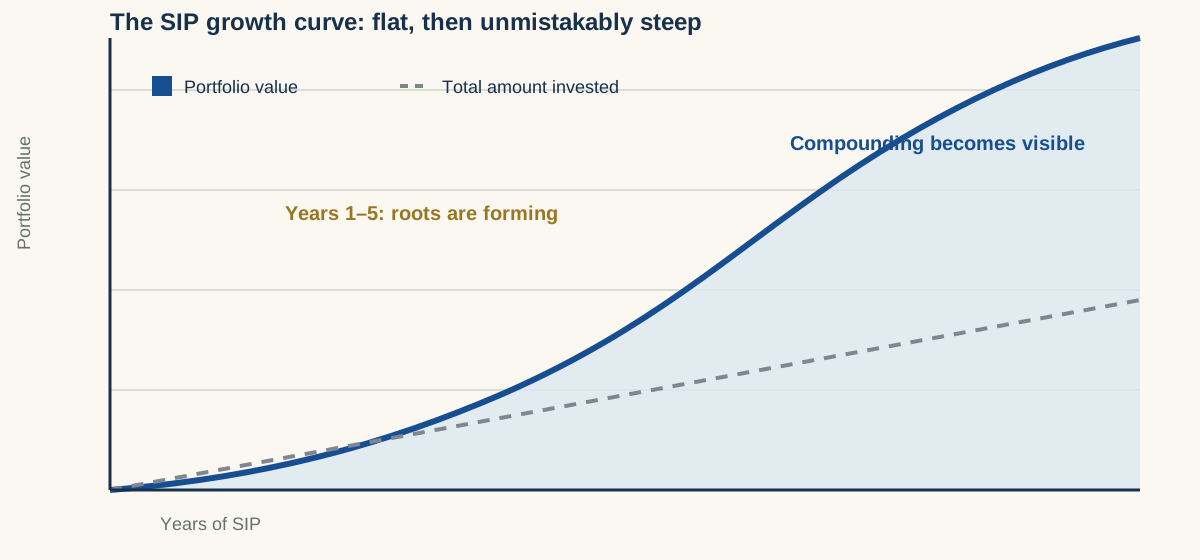
- After year 1: about ₹0.60 lakh invested, worth roughly ₹0.64 lakh.
- After year 5: about ₹3.0 lakh invested, worth roughly ₹4.12 lakh.
- After year 10: about ₹6.0 lakh invested, worth roughly ₹11.62 lakh.
- After year 15: about ₹9.0 lakh invested, worth roughly ₹25.23 lakh.
For roughly the first five to six years, the portfolio-value line and the amount-invested line sit almost on top of each other. An investor checking their statement every month during this stretch is, in effect, watching soil. The visible acceleration only shows up once the base is large enough for returns to start outrunning contributions, which is a roundabout way of describing what compounding actually is.
The Part Nobody Feels in Real Time
Human intuition is linear. Compounding is not. Break the same SIP down into how much wealth was added in each individual year, rather than the cumulative total, and the disconnect becomes obvious.
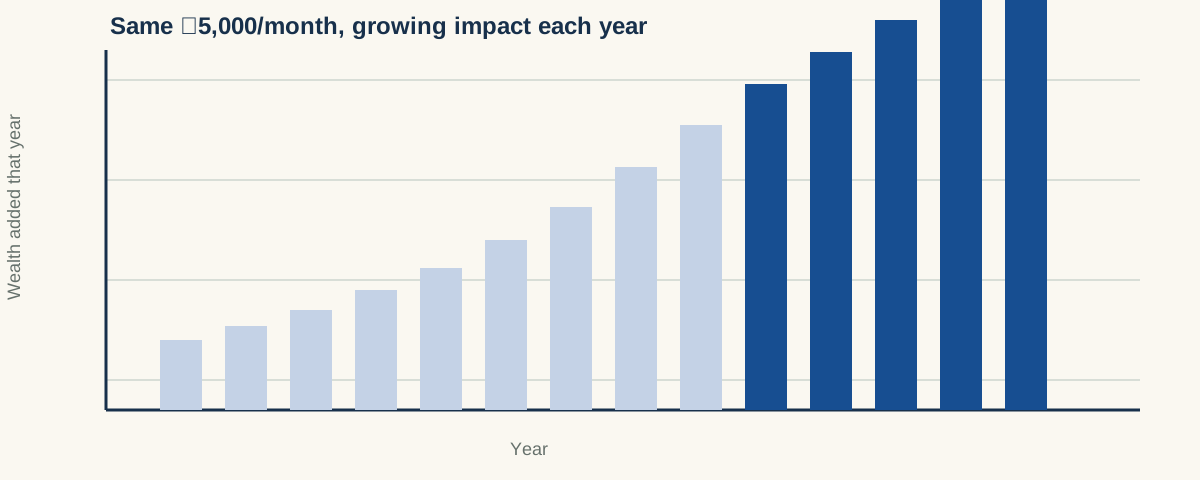
The monthly contribution never changes across this example. Yet the wealth added in year fifteen alone, roughly ₹3.4 lakh, is more than five times the wealth added in year one, roughly ₹0.64 lakh. Nothing about the investor's behaviour changed. What changed is the size of the base that each year's return was compounding on, built slowly and invisibly in the years before it.
Why Investors Quit Right Before the Payoff
If the math is this straightforward, why does nearly every investor feel the urge to stop somewhere in years two to four? The reasons sit in ordinary psychology, not in any flaw in the SIP itself.
- Loss aversion and boredom compete for attention. A flat SIP doesn't lose money dramatically enough to trigger fear, but it also doesn't deliver the thrill of a quick win.
- Comparison is corrosive. It's easy to find someone whose single lump-sum bet outperformed a boring monthly SIP over a short window. Comparing a root system to a stock tip isn't a fair comparison, but it feels like one in the moment.
- Visible effort, invisible result. The debit happens every month. The discipline is real. But the account doesn't yet look different enough to reward that effort.
- Market noise is loudest early. Volatility looks scarier when the base amount is still small and new, even though the percentage swings are no different than they will be later.
What the Roots Are Actually Doing
It's worth being precise about what “the roots” mean inside a SIP, because the analogy is only useful if it maps to something real.
- Rupee-cost averaging: the SIP buys more units when markets are down and fewer when they're up, smoothing the average purchase price without anyone timing anything.
- Growing principal: every fresh instalment adds to a base that is also quietly generating its own returns, which then generate returns of their own.
- Behavioural discipline: investing regardless of market mood keeps the investor in the plan long enough for visible growth to arrive.
- Time underground: there is no shortcut for time. A larger SIP run for three years cannot substitute for a modest SIP left alone for twelve.
What This Isn't Saying
- It doesn't say every investment eventually takes off. The analogy assumes a reasonably diversified, well-chosen portfolio, not a single stock or speculative bet.
- It doesn't say 12% is guaranteed. Actual returns will vary and can be negative in any given year, including several years in a row.
- It doesn't say patience alone is a strategy. Reviewing asset allocation, staying diversified, and adjusting for changing goals still matter.
The Big Picture
The farmer who quit in year three would never have known how close the bamboo was to breaking through the surface. There was no visible signal in year three that year five would look any different. The only piece of information that mattered was the one he couldn't see: how much root structure had already been built, quietly, underground.
A SIP asks for the same kind of trust and offers the same kind of reward. There is rarely a visible signal, in month eighteen or year three, that tells an investor the compounding is about to become obvious. The account simply keeps doing what it has always been doing until, at some point that cannot be predicted in advance, it very visibly is.